Robotrader

Forex algorithmic Trading Strategies

No one trader can win every trade. To be successful in Forex trading, you need to have a range of strategies that you can use depending on the market conditions.

image
Robotrader | Best Algo Trading Software & Platform In India, Forex Trading Strategies

Forex Trend Trading Strategy

When it comes to trading, it's important to know the trend of the market. After all, that's what all the technical analysis tools are for! But what is foreign exchange market trend? In a nutshell, it simply means the direction in which the market moves. It can be a little more complicated than that, but basically, if you understand trend you're on your way to understanding forex Trading.

image14
image

Support and Resistance Trading Strategy

In order to understand support and resistance trading, you first need to know what horizontal levels are. Horizontal levels are price levels that indicate either a support or resistance in the market. The support and resistance in technical analysis are the terms for price lows and highs respectively. The term support indicates the area on the chart where buyers are likely to enter the market and prop up prices, while resistance is where sellers typically congregate and push prices lower.

The concept behind support and resistance trading is still the same - buying a security when we expect it to increase in price and sell when expecting its price to go down. Thus, when the price falls to the support level, traders decide to buy creating demand and driving the price up. In the same way, when the price rises to a resistance level, traders decide to sell, creating a downward pressure and driving the price down.

Technical Indicators in Forex Trading Strategies

Traders love technical analysis indicators because they can form buy and sell signals through crossovers and divergence. Crossovers are reflected when price moves through the moving average or when two different moving averages cross each other. Divergence happens when the price trend and the indicator trend move in opposite directions indicating that the direction of price trend is weakening.
But I have to be honest with you, they're not always right! In fact, sometimes they give false signals. For example, a bullish crossover can happen when prices are actually dropping, or a bearish divergence can form when prices are heading higher. So it's important to use them in conjunction with other indicators and tools to get a better idea of what's going on in the market.

Moving Average Bollinger Bands,
Relative Strength Index (RSI)
Stochastic Oscillator
Moving Average Convergence/Divergence (MACD)
RSI-Bars
ADX Momentum
You can easily learn how to use each indicator and develop trading strategies by indicators

image14
image

Forex Range Trading Strategy

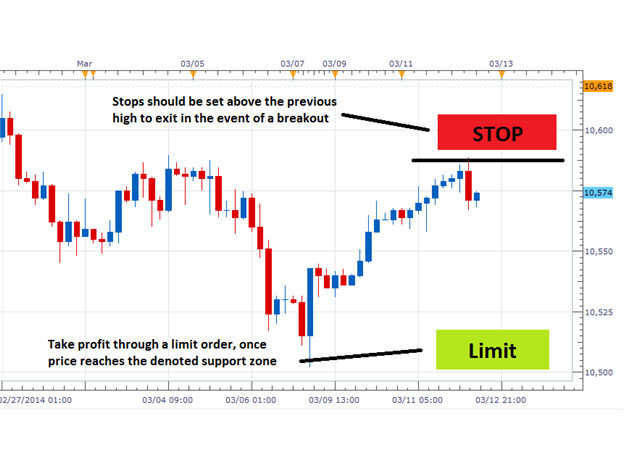
I wanted to talk a little bit about range trading, which is also called channel trading. This is a strategy that's generally used during the absence of a trend, and it involves identifying currency price movement in channels. The first task is to find the range, and this can be done by connecting a series of highs and lows with a horizontal trendline. Once you've done that, the next step is to wait for the market to break out of the range. If it does, you'll want to get into a short position; if it doesn't, then you'll want to go long. Thanks for listening!

In range trading it’s quite easy to find the areas to take profit. You can buy at support and sell at resistance as long as the security hasn’t broken out of the channel. Otherwise, if the breakout direction is not favorable for your position, you may undergo huge losses